Cool HTML5 and jQuery Animated pie Chart

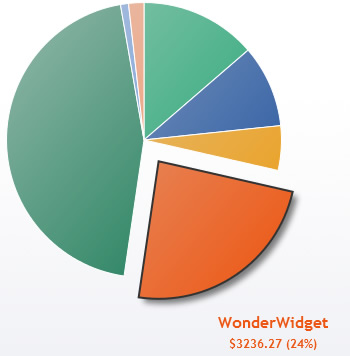
In this tutorial we'll going to show you how to build a lovely, interactive pie chart using the latest HTML5 technologies. Not that long ago, this kind of thing was only practical to do with Flash. Now, thanks to advances such as the HTML5 canvas element, we can create pretty nifty animated effects using nothing but JavaScript, CSS, and a small sprinkling of maths!
Step 1. Create the markup
Here's the markup for our chart page:
<!DOCTYPE html>
<html xmlns="http://www.w3.org/1999/xhtml">
<head>

<title>Elated.com | Snazzy Animated Pie Chart with HTML5 and jQuery - Demo</title>
<meta http-equiv="Content-Type" content="text/html;charset=utf-8" >

</head>
<body>

<div id="container">

  <div class="wideBox">
    <h1>Widgets Sold in 2010</h1>
    <p>Click a colour in the chart, or an item in the table, to pull out a slice! <a href="#">Back to Tutorial</a></p>
  </div>

  <canvas id="chart" width="600" height="500"></canvas>

  <table id="chartData">

    <tr>
      <th>Widget</th><th>Sales ($)</th>
     </tr>

    <tr style="color: #0DA068">
      <td>SuperWidget</td><td>1862.12</td>
    </tr>

    <tr style="color: #194E9C">
      <td>MegaWidget</td><td>1316.00</td>
    </tr>

    <tr style="color: #ED9C13">
      <td>HyperWidget</td><td>712.49</td>
    </tr>

    <tr style="color: #ED5713">
      <td>WonderWidget</td><td>3236.27</td>
    </tr>

    <tr style="color: #057249">
      <td>MicroWidget</td><td>6122.06</td>
    </tr>

    <tr style="color: #5F91DC">
      <td>NanoWidget</td><td>128.11</td>
    </tr>

    <tr style="color: #F88E5D">
      <td>LovelyWidget</td><td>245.55</td>
    </tr>
  </table>

  <div class="wideBox">
    <p>© Elated.com | <a href="#">Back to Tutorial</a></p>
    <p style="font-size: .8em"><a rel="license" "><img alt="Creative Commons License" style="border-width:0" src="http://i.creativecommons.org/l/by/3.0/88x31.png" /></a><br />This <span xmlns:dc="http://purl.org/dc/elements/1.1/" href="http://purl.org/dc/dcmitype/Text" rel="dc:type">work</span> by <a xmlns:cc="http://creativecommons.org/ns#" href="http://www.elated.com/" property="cc:attributionName" rel="cc:attributionURL">http://www.elated.com/</a> is licensed under a <a rel="license" href="http://creativecommons.org/licenses/by/3.0/">Creative Commons Attribution 3.0 Unported License</a>.</p>
  </div>

</div>

</body>
</html>
The markup is pretty simple. It contains:
-
A
"container"divto wrap and centre the content -
An HTML5
canvaselement for the pie chart -
A
tableelement containing the chart data - Header and footer boxes containing the chart title, copyright and so on
Notice that the tr (table row) elements in the table are all given their own colours. Later, we'll use our JavaScript to read these colour values and use them to colour the corresponding pie chart slices.
Step 2. Create the CSS
Now we've created our basic HTML page, let's add some CSS to style the various elements in the page:
<style>

body {
  background: #fff;
  color: #333;
  font-family: "Trebuchet MS", Verdana, Arial, Helvetica, sans-serif;
  font-size: 0.9em;
  padding: 40px;
}

.wideBox {
  clear: both;
  text-align: center;
  margin-bottom: 50px;
  padding: 10px;
  background: #ebedf2;
  border: 1px solid #333;
  line-height: 80%;
}

#container {
  width: 900px;
  margin: 0 auto;
}

#chart, #chartData {
  border: 1px solid #333;
  background: #ebedf2 url("images/gradient.png") repeat-x 0 0;
}

#chart {
  display: block;
  margin: 0 0 50px 0;
  float: left;
  cursor: pointer;
}

#chartData {
  width: 200px;
  margin: 0 40px 0 0;
  float: right;
  border-collapse: collapse;
  box-shadow: 0 0 1em rgba(0, 0, 0, 0.5);
  -moz-box-shadow: 0 0 1em rgba(0, 0, 0, 0.5);
  -webkit-box-shadow: 0 0 1em rgba(0, 0, 0, 0.5);
  background-position: 0 -100px;
}

#chartData th, #chartData td {
  padding: 0.5em;
  border: 1px dotted #666;
  text-align: left;
}

#chartData th {
  border-bottom: 2px solid #333;
  text-transform: uppercase;
}

#chartData td {
  cursor: pointer;
}

#chartData td.highlight {
  background: #e8e8e8;
}

#chartData tr:hover td {
  background: #f0f0f0;
}

</style>
Again, no big surprises here. The CSS contains rules for the page body, the wide header/footer boxes, the container, the #chart canvas element, and the #chartData table element.
A couple of points to note:
-
The
#chartand#chartDataelements are given a subtle gradient background, created using the imagegradient.png(included in the code download). Yes, you can even have background images oncanvaselements! -
We've used the CSS3
box-shadowproperty (and its vendor-specific equivalents) to add a drop shadow to the data table. (While it's also possible to add a drop shadow to thecanvaselement, I found that this really slowed down the pie chart animation on WebKit browsers.)
Step 3. Include the jQuery and ExplorerCanvas libraries
Now we're ready to start writing our JavaScript code. First of all, include 2 libraries:
<script src="http://ajax.googleapis.com/ajax/libs/jquery/1.4.2/jquery.min.js"></script>
<!--[if IE]>
<script src="http://explorercanvas.googlecode.com/svn/trunk/excanvas.js"></script>
<![endif]-->
<script>
Step 4. Create the main function, config settings, and useful variables
We'll wrap our code in a main function called pieChart(). That way, we can keep all functions and variables related to the chart in one place, and not pollute the global scope. We'll then use jQuery to call pieChart() when the page's DOM is ready.
Let's start by putting various useful configuration settings inside pieChart():
// Run the code when the DOM is ready
$( pieChart );

function pieChart() {

  // Config settings
  var chartSizePercent = 55;                        // The chart radius relative to the canvas width/height (in percent)
  var sliceBorderWidth = 1;                         // Width (in pixels) of the border around each slice
  var sliceBorderStyle = "#fff";                    // Colour of the border around each slice
  var sliceGradientColour = "#ddd";                 // Colour to use for one end of the chart gradient
  var maxPullOutDistance = 25;                      // How far, in pixels, to pull slices out when clicked
  var pullOutFrameStep = 4;                         // How many pixels to move a slice with each animation frame
  var pullOutFrameInterval = 40;                    // How long (in ms) between each animation frame
  var pullOutLabelPadding = 65;                     // Padding between pulled-out slice and its label
  var pullOutLabelFont = "bold 16px 'Trebuchet MS', Verdana, sans-serif";  // Pull-out slice label font
  var pullOutValueFont = "bold 12px 'Trebuchet MS', Verdana, sans-serif";  // Pull-out slice value font
  var pullOutValuePrefix = "$";                     // Pull-out slice value prefix
  var pullOutShadowColour = "rgba( 0, 0, 0, .5 )";  // Colour to use for the pull-out slice shadow
  var pullOutShadowOffsetX = 5;                     // X-offset (in pixels) of the pull-out slice shadow
  var pullOutShadowOffsetY = 5;                     // Y-offset (in pixels) of the pull-out slice shadow
  var pullOutShadowBlur = 5;                        // How much to blur the pull-out slice shadow
  var pullOutBorderWidth = 2;                       // Width (in pixels) of the pull-out slice border
  var pullOutBorderStyle = "#333";                  // Colour of the pull-out slice border
  var chartStartAngle = -.5 * Math.PI;              // Start the chart at 12 o'clock instead of 3 o'clock

  // Declare some variables for the chart
  var canvas;                       // The canvas element in the page
  var currentPullOutSlice = -1;     // The slice currently pulled out (-1 = no slice)
  var currentPullOutDistance = 0;   // How many pixels the pulled-out slice is currently pulled out in the animation
  var animationId = 0;              // Tracks the interval ID for the animation created by setInterval()
  var chartData = [];               // Chart data (labels, values, and angles)
  var chartColours = [];            // Chart colours (pulled from the HTML table)
  var totalValue = 0;               // Total of all the values in the chart
  var canvasWidth;                  // Width of the canvas, in pixels
  var canvasHeight;                 // Height of the canvas, in pixels
  var centreX;                      // X-coordinate of centre of the canvas/chart
  var centreY;                      // Y-coordinate of centre of the canvas/chart
  var chartRadius;                  // Radius of the pie chart, in pixels

  // Set things up and draw the chart
  init();
Most of these lines should be easy to understand by looking at the comments in the code. A few warrant closer inspection:
-
chartSizePercent - To allow room for pulling out slices and displaying labels, we want the actual pie chart to be a fair bit smaller than the canvas. In this case, 55% is a good setting.
-
chartStartAngle - By default, angles in JavaScript — as in most other languages — are specified in radians, where 0 radians is the 3 o'clock position. Since we want to start our chart from 12 o'clock, we'll use this setting to subtract π/2 radians — that is, a quarter turn — from various angles in the code. I've explained this visually in the figure below.
-
currentPullOutSliceandcurrentPullOutDistance -
Since we'll be animating a slice as it pulls out from the pie, we need these variables to track the animation.
currentPullOutSlicetracks which slice is being pulled out, or has been pulled out (a value of -1 means that no slices are pulled out), andcurrentPullOutDistancetracks how much the slice has been pulled out so far. -
animationId -
This will hold the value returned by
setInterval()when we create the animation. It's a numeric ID that we can then pass toclearInterval()when we want to end the animation. -
chartData - We'll use this array to store data about each slice in the chart, including its label and value (pulled from the HTML table), and its start and end angles.
-
chartColours - This array will hold the colour of each slice in the chart, again pulled from the HTML table.
-
init() -
The last line of code calls an
init()function, which sets up the chart and gets things going. We'll write this function next!
Step 5. Initialise the chart
We're now ready to set up our chart. Let's write an init() function to do all the setup for us:
/**
   * Set up the chart data and colours, as well as the chart and table click handlers,
   * and draw the initial pie chart
   */

  function init() {

    // Get the canvas element in the page
    canvas = document.getElementById('chart');

    // Exit if the browser isn't canvas-capable
    if ( typeof canvas.getContext === 'undefined' ) return;

    // Initialise some properties of the canvas and chart
    canvasWidth = canvas.width;
    canvasHeight = canvas.height;
    centreX = canvasWidth / 2;
    centreY = canvasHeight / 2;
    chartRadius = Math.min( canvasWidth, canvasHeight ) / 2 * ( chartSizePercent / 100 );

    // Grab the data from the table,
    // and assign click handlers to the table data cells

    var currentRow = -1;
    var currentCell = 0;

    $('#chartData td').each( function() {
      currentCell++;
      if ( currentCell % 2 != 0 ) {
        currentRow++;
        chartData[currentRow] = [];
        chartData[currentRow]['label'] = $(this).text();
      } else {
       var value = parseFloat($(this).text());
       totalValue += value;
       value = value.toFixed(2);
       chartData[currentRow]['value'] = value;
      }

      // Store the slice index in this cell, and attach a click handler to it
      $(this).data( 'slice', currentRow );
      $(this).click( handleTableClick );

      // Extract and store the cell colour
      if ( rgb = $(this).css('color').match( /rgb\((\d+), (\d+), (\d+)/) ) {
        chartColours[currentRow] = [ rgb[1], rgb[2], rgb[3] ];
      } else if ( hex = $(this).css('color').match(/#([a-fA-F0-9]{2})([a-fA-F0-9]{2})([a-fA-F0-9]{2})/) ) {
        chartColours[currentRow] = [ parseInt(hex[1],16) ,parseInt(hex[2],16), parseInt(hex[3], 16) ];
      } else {
        alert( "Error: Colour could not be determined! Please specify table colours using the format '#xxxxxx'" );
        return;
      }

    } );

    // Now compute and store the start and end angles of each slice in the chart data

    var currentPos = 0; // The current position of the slice in the pie (from 0 to 1)

    for ( var slice in chartData ) {
      chartData[slice]['startAngle'] = 2 * Math.PI * currentPos;
      chartData[slice]['endAngle'] = 2 * Math.PI * ( currentPos + ( chartData[slice]['value'] / totalValue ) );
      currentPos += chartData[slice]['value'] / totalValue;
    }

    // All ready! Now draw the pie chart, and add the click handler to it
    drawChart();
    $('#chart').click ( handleChartClick );
  }
Note that init(), as well as all the other functions we'll create from now on, should go inside the outer pieChart() function. Functions within functions, where the inner function accesses variables declared in the outer function, are known as closures.
The init() function is fairly lengthy, so let's break it down:
-
Get the
canvaselement
First we get the"#chart"canvaselement from the page and store it in an object calledcanvas. We'll do all of our drawing on the canvas through this object. -
Check for
canvassupport in the browser
Before we do anything else, we should check that the browser actually supports the HTML5canvaselement. We do this by seeing if thecanvasobject contains thegetContext()method — a frequently-used method that we'll use later on. If it doesn't, then the browser presumably doesn't supportcanvas, so we exit the function. -
Compute and store the canvas and chart dimensions
Since we'll frequently use values like the canvas width, height, and centre, as well as the chart radius, we compute these values now and store them in variables for use later on. -
Grab the data from the table
We use a jQuery selector —$('#chartData td')— to select all the data cells in the table. We can then iterate through these cells with the jQueryeach()method. For each cell, we determine if it's a label (e.g. "SuperWidget") or a value (e.g. "1862.12") cell, based on whether it's in the left or right column. We then store the cell contents under the'label'or'value'key in an associative array, which we then place inside thechartDataarray. -
Store the slice index with each table cell, and assign a
clickhandler to the cell
While we're looping through the table cells, we store the current row index (and therefore slice index) in a key called'slice'inside the jQuery object holding the table cell. We do this using the handy jQuerydata()method. That way, we can easily find out which slice a cell refers to whenever the cell is clicked on. We also assign aclickevent handler function,handleTableClick(), to the cell, so that when the cell is clicked on we can animate the chart appropriately. We'll create this function in a moment. -
Extract the cell colour and store it in the
chartColoursarray
In the last part of the loop, we use jQuery to extract the colour of the cell by looking at itscolorCSS property. We then store its colour in thechartColorsarray, as a 3-element nested array containing the red, green, and blue values (in decimal).Most browsers return an element's colour in the format
"rgb(r, g, b)". However, some browsers (*cough* IE *cough*) simply return the colour in whatever format it was specified in the CSS (e.g."#RRGGBB"). So our code uses regular expressions to check for both scenarios. -
Compute and store the start and end angles of each slice
We'll need to know the angles at which each pie slice starts and ends fairly often throughout the code, so we'll pre-compute them here and store them in'startAngle'and'endAngle'elements of the associative array insidechartData. We do this by looping through the slices, usingcurrentPosto keep a record of the running total as a ratio of the grand total (between 0 and 1). We can then multiply this running total by 2π radians (a whole turn) to get the start and end angles for each slice.The slice angles stored in
chartDatarun from 0 to 2π (3 o'clock to 3 o'clock). We'll need to offset these angles using thechartStartAnglevariable when we actually draw the slices, so that the pie starts from 12 o'clock instead. -
Draw the chart and attach a
clickhandler to thecanvas
Finally, ourinit()function calls adrawChart()function to draw the initial pie chart. (We'll create this function later.) It also assigns aclickevent handler function,handleChartClick(), to thecanvaselement, so that when the chart is clicked we can pull out or push in a slice as appropriate. We'll write this function next.
Step 6. Write a click handler for the pie chart
We now need to write our handleChartClick() event handler function. This is called automatically whenever the user clicks inside the canvas element.
Here's the code for the function:
 /**
   * Process mouse clicks in the chart area.
   *
   * If a slice was clicked, toggle it in or out.
   * If the user clicked outside the pie, push any slices back in.
   *
   * @param Event The click event
   */

  function handleChartClick ( clickEvent ) {

    // Get the mouse cursor position at the time of the click, relative to the canvas
    var mouseX = clickEvent.pageX - this.offsetLeft;
    var mouseY = clickEvent.pageY - this.offsetTop;

    // Was the click inside the pie chart?
    var xFromCentre = mouseX - centreX;
    var yFromCentre = mouseY - centreY;
    var distanceFromCentre = Math.sqrt( Math.pow( Math.abs( xFromCentre ), 2 ) + Math.pow( Math.abs( yFromCentre ), 2 ) );

    if ( distanceFromCentre <= chartRadius ) {

      // Yes, the click was inside the chart.
      // Find the slice that was clicked by comparing angles relative to the chart centre.

      var clickAngle = Math.atan2( yFromCentre, xFromCentre ) - chartStartAngle;
      if ( clickAngle < 0 ) clickAngle = 2 * Math.PI + clickAngle;

      for ( var slice in chartData ) {
        if ( clickAngle >= chartData[slice]['startAngle'] && clickAngle <= chartData[slice]['endAngle'] ) {

          // Slice found. Pull it out or push it in, as required.
          toggleSlice ( slice );
          return;
        }
      }
    }

    // User must have clicked outside the pie. Push any pulled-out slice back in.
    pushIn();
  }
read more:http://www.elated.com/articles/snazzy-animated-pie-chart-html5-jquery/
You might also like
Tags
accordion accordion menu animation navigation animation navigation menu carousel checkbox inputs css3 css3 menu css3 navigation date picker dialog drag drop drop down menu drop down navigation menu elastic navigation form form validation gallery glide navigation horizontal navigation menu hover effect image gallery image hover image lightbox image scroller image slideshow multi-level navigation menus rating select dependent select list slide image slider menu stylish form table tabs text effect text scroller tooltips tree menu vertical navigation menu

 Subscribe
 Follow Us
 13 years ago
 24766
24766 4799
4799


