CSS3 and jQuery Interactive Graph
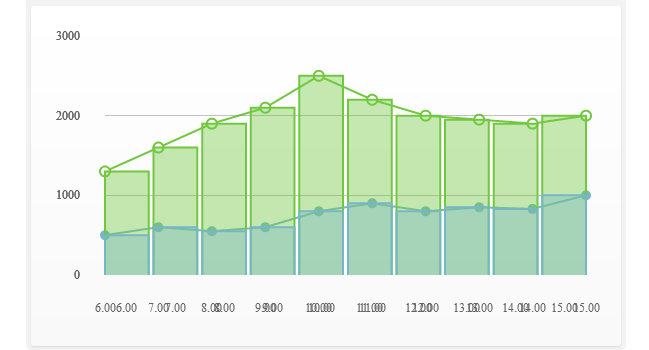
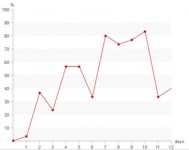
we will code an Interactive Graph using jQuery and CSS3. We will use the jQuery’s popular plotting plugin “Flot”. Flot is a pure JavaScript plotting library for jQuery. It produces graphical plots of arbitrary datasets on-the-fly client-side. This plugin is simple but powerful enough to create some nice and interactive graphs
Step 1 – HTML Markup
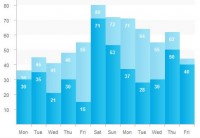
To start we will create our html markup for the graph. We will create a <div> with the class “graph-wrapper”. Inside of this <div> we will add two more <div>. The first one will have the “graph-info” class, this div will contain the graph legend and the buttons that will allow us to switch between graphs. The second div will contain the two graphics (lines and bars).
<!-- Graph HTML -->
<div id="graph-wrapper">
    <div class="graph-info">
        <a href="javascript:void(0)" class="visitors">Visitors</a>
        <a href="javascript:void(0)" class="returning">Returning Visitors</a>

        <a href="#" id="bars"><span></span></a>
        <a href="#" id="lines" class="active"><span></span></a>
    </div>

    <div class="graph-container">
        <div id="graph-lines"></div>
        <div id="graph-bars"></div>
    </div>
</div>
<!-- end Graph HTML -->
Step 2 – jQuery and Flot Plugin
Let’s include the JavaScript now. Firs think we need to add is the jQuery Library. I will link to the one hosted by Google. You can link to that one too or download it and host on your server. Then download the “Flot” files and include the “jquery.flot.min.js”. We will also add another script tag and there we will add all the scripts to make our graphs work.
<script src="https://ajax.googleapis.com/ajax/libs/jquery/1.7.2/jquery.min.js"></script>
<script src="js/jquery.flot.min.js"></script>
<script>
$(document).ready(function () {
    // Graph scripts here
});
</script>
Read more:http://designmodo.com/create-interactive-graph-css3-jquery/
You might also like
Tags
accordion accordion menu animation navigation animation navigation menu carousel checkbox inputs css3 css3 menu css3 navigation date picker dialog drag drop drop down menu drop down navigation menu elastic navigation form form validation gallery glide navigation horizontal navigation menu hover effect image gallery image hover image lightbox image scroller image slideshow multi-level navigation menus rating select dependent select list slide image slider menu stylish form table tabs text effect text scroller tooltips tree menu vertical navigation menu

 Subscribe
 Follow Us
 11 years ago
 9687
9687 2657
2657
