 Subscribe
 Follow Us
JavaScript Visualization Charts Library
 12 years ago
 6803
6803 2578
2578
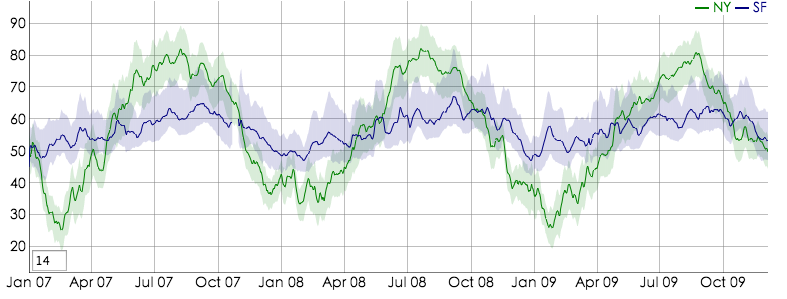
dygraphs is an open source JavaScript library that produces produces interactive, zoomable charts of time series. It is designed to display dense data sets and enable users to explore and interpret them.
Features
Some of the features of dygraphs:
- Plots time series without using an external server or Flash
- Works in Internet Explorer (using excanvas)
- Lightweight (69kb) and responsive
- Displays values on mouseover, making interaction easily discoverable
- Supports error bands around data series
- Interactive zoom
- Displays Annotations on the chart
- Adjustable averaging period
- Can intelligently chart fractions
- Customizable click-through actions
- Compatible with the Google Visualization API
- Intelligent defaults make it easy to use
More Info
You might also like
Tags
accordion accordion menu animation navigation animation navigation menu carousel checkbox inputs css3 css3 menu css3 navigation date picker dialog drag drop drop down menu drop down navigation menu elastic navigation form form validation gallery glide navigation horizontal navigation menu hover effect image gallery image hover image lightbox image scroller image slideshow multi-level navigation menus rating select dependent select list slide image slider menu stylish form table tabs text effect text scroller tooltips tree menu vertical navigation menu